Bollinger bands strategies that a currency ETF trader should be aware of
If you are an ETF trader, you should know the many Bollinger bands strategies that can help improve your trading results. This blog post will look at three Bollinger bands strategies that an ETF trader can use to make money in the market. We’ll discuss when it is appropriate to use these strategies and how to implement them in your trading plan.
Bollinger bands explained
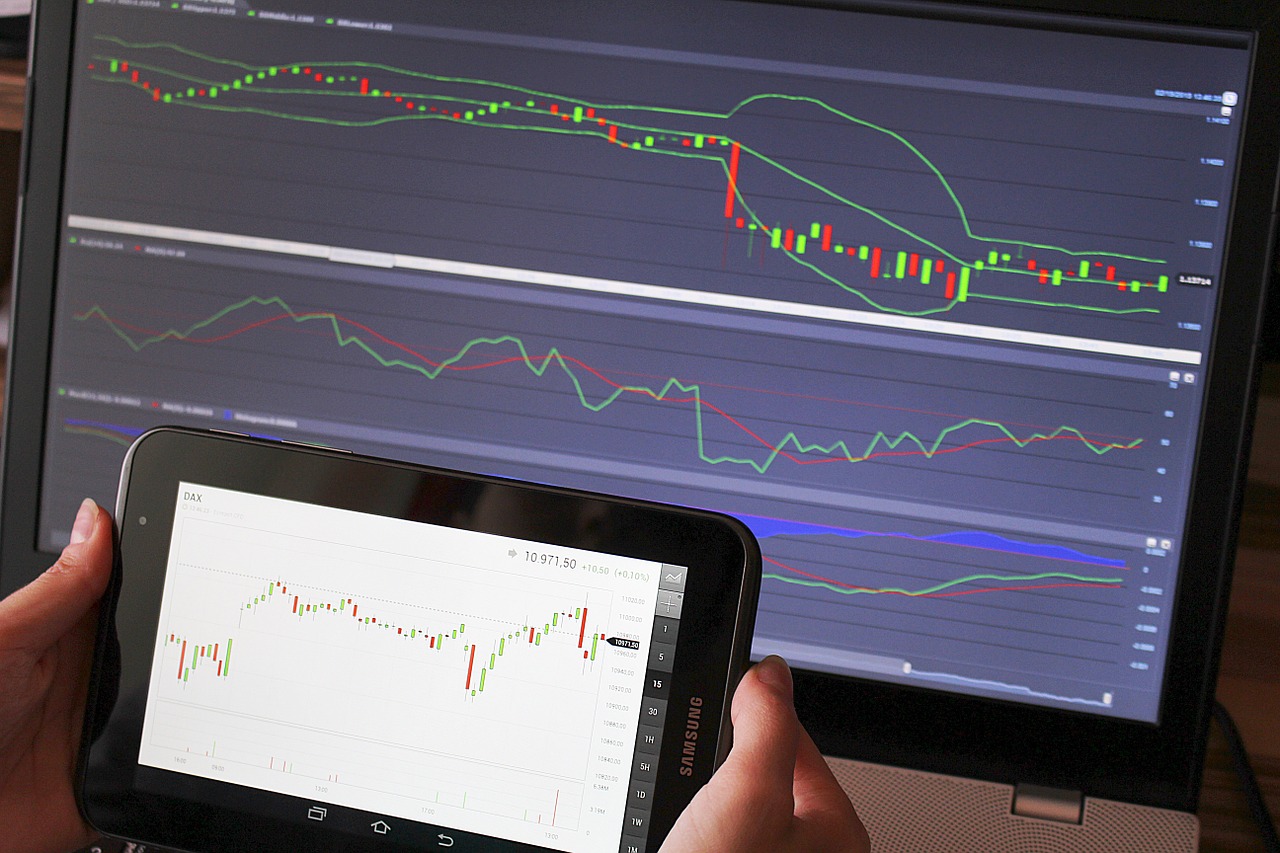
Bollinger bands are an excellent technical analysis tool used by Forex traders to help them identify potential trading opportunities. They are calculated using a simple formula that considers the moving average of a currency pair’s price and the standard deviation of that price.
The result is a brand placed above and below the moving average. When a currency pair’s price moves outside the Bollinger band, it experiences a Bollinger squeeze. It often signals that a period of high volatility is about to begin, and Forex traders can use this information to help them make better trading decisions.
Using Bollinger Bands to identify overbought and oversold conditions
Forex traders often use Bollinger bands to identify overbought and oversold conditions. The Bollinger band is an indicator that consists of three lines. The middle line is a simple moving average, and the upper and lower lines are calculated as a certain number of standard deviations above and below the middle line.
When the price exceeds the middle line, it is considered an uptrend, and when the price is below the middle line, it is considered a downtrend. However, it is overbought or oversold when the price moves outside the upper or lower Bollinger band.
Forex traders can use this information to help make trading decisions. For example, if the price is oversold, a trader might buy in anticipation of a rebound. Conversely, if the price is overbought, a trader might sell in anticipation of a correction. While Bollinger bands are not always accurate, they can be a helpful tool for Forex traders.
Using Bollinger bands to identify price trends
Bollinger bands are a technical indicator that Forex traders use to identify price trends. The indicator comprises three lines: an upper line, a lower line, and a middle line. When prices are trending higher, the upper line acts as a resistance level, while the lower line acts as a support level. Similarly, when prices are trending lower, the upper line acts as a support level, while the lower line acts as a resistance level. Traders can use Bollinger bands to identify both trend reversals and continuation patterns.
Trade using Bollinger bands
Forex traders identify potential trading opportunities with Bollinger bands. Forex traders can look for potential entry and exit points by watching candlestick patterns that form near the Bollinger bands. A Bearish Engulfing pattern near the upper Bollinger band could signal a potential reversal in price.
A Bullish Engulfing pattern near the lower Bollinger band could indicate a possible reversal to the upside. Traders should also be aware of false breakouts, which can occur when the price breaks out of one of the Bollinger bands, only to return inside the range quickly. False breakouts can often lead to sharp moves in price, so it is essential to be aware of them when trading with Bollinger bands.
Bollinger band trading strategies
Traders can use the Bollinger Bands in several different ways. Still, some of the most popular Bollinger Band strategies include using the bands to identify reversals, breakouts, and continuation patterns, as previously mentioned. Traders will often look for price action to bounce off the upper or lower Bollinger Band to indicate that the market is overbought or oversold. A breakout above or beneath the Bollinger Bands may indicate a new trend.
Some traders use Bollinger Bands to trade or scalp the market for small profits. Traders may use the Bollinger Bands to identify periods of consolidation, during which they may look for opportunities to enter trades in anticipation of a breakout. While there are several ways to use Bollinger Bands, these are only some of the most popular strategies traders employ.
